Open Humanities Awards: 2nd round – Deadline extended to 6 June 2014!

OpenHumanitiesLogos

We are excited to announce the second round of the Open Humanities Awards. *The deadline for submissions to the awards has been extended to Friday 6 June 2014.*

There are €20,000 worth of prizes on offer in two dedicated tracks:

  • Open track: for projects that either use open content, open data or open source tools to further humanities teaching and research

  • DM2E track: for projects that build upon the research, tools and data of the DM2E project

Whether you’re interested in patterns of allusion in Aristotle, networks of correspondence in the Jewish Enlightenment or digitising public domain editions of Dante, we’d love to hear about the kinds of open projects that could support your interest!

Why are we running these Awards?

Humanities research is based on the interpretation and analysis of a wide variety of cultural artefacts including texts, images and audiovisual material. Much of this material is now freely and openly available on the internet enabling people to discover, connect and contextualise cultural artefacts in ways previously very difficult.

We want to make the most of this new opportunity by encouraging budding developers and humanities researchers to collaborate and start new projects that use this open content and data paving the way for a vibrant cultural and research commons to emerge.

In addition, DM2E has developed tools to support Digital Humanities research, such as Pundit (a semantic web annotation tool), and delivered several interesting datasets from various content providers around Europe. The project is now inviting all researchers to submit a project building on this DM2E research in a special DM2E track.

Who can apply?

The Awards are open to any citizen of the EU.

Who is judging the Awards?

The Awards will be judged by a stellar cast of leading Digital Humanists:

What do we want to see?

maphub_oa_comment.png

Maphub, an open source Web application for annotating digitized historical maps, was one of the winners of the first round of the Open Humanities awards

For the Open track, we are challenging humanities researchers, designers and developers to create innovative projects open content, open data or open source to further teaching or research in the humanities. For example you might want to:

  • Start a project to collaboratively transcribe, annotate, or translate public domain texts

  • Explore patterns of citation, allusion and influence using bibliographic metadata or textmining

  • Analyse and/or visually represent complex networks or hidden patterns in collections of texts

  • Use computational tools to generate new insights into collections of public domain images, audio or texts

You could start a project from scratch or build on an existing project. For inspiration you can have a look at the final results of our first round winners: Joined Up Early Modern Diplomacy and Maphub, or check out the open-source tools the Open Knowledge Foundation has developed for use with cultural resources.

As long as your project involves open content, open data or open source tools and makes a contribution to humanities research, the choice is yours!

For the DM2E track, we invite you to submit a project building on the DM2E research: information, code and documentation on the DM2E tools is available through our DM2E wiki, the data is at http://data.dm2e.eu. Examples include:

  • Building open source tools or applications based on the API’s developed

  • A project focused on the visualisation of data coming from Pundit

  • A deployment of the tools for specific communities

  • A project using data aggregated by DM2E in an innovative way

  • An extension of the platform by means of a practical demonstrative application

Who is behind the awards?

The Awards are being coordinated by the Open Knowledge Foundation and are part of the DM2E project. They are also supported by the Digital Humanities Quarterly.

How to apply

Applications are open from today (30 April 2014). Go to openhumanitiesawards.org to apply. The application deadline has been extended to 6 June 2014, so get going and good luck!

More information…

For more information on the Awards including the rules and ideas for open datasets and tools to use visit openhumanitiesawards.org.


Fourth Digital Humanities Advisory Board meeting

On 3 April 2014 the DM2E Digital Humanities Advisory Board held their fourth meeting through Skype. This Board is responsible for steering the research direction of the DM2E project and ensuring that the technical development on the project responds to the needs of scholars.

Attendees from the Digital Humanities Advisory Board included:

  • Sally Chambers (DARIAH)
  • Alastair Dunning (Europeana)
  • Dirk Wintergrün (Max-Planck-Institut für Wissenschaftsgeschichte)
  • Felix Sasaki (W3C)
  • Alois Pichler (University of Bergen)
  • Laurent Romary (INRIA)

In this meeting, Vivien Petras (Project coordinator, Humboldt-Universität) presented a summary of what happened in DM2E in the second project year.

Christian Morbidoni (Net7) gave an overview of the progress of work package 3, which is researching the scholarly practices in the humanities as well as building the tools that respond to the needs of scholars.

Next, the workplan for the research on the digital humanities scholarly primitives was presented by Steffen Hennicke (Humboldt-Universität) and discussed between Board members. The three main principle research objectives of this task are (1) to investigate the functional primitives of Digital Humanists, (2) the kinds of reasoning Digital Humanists want to see enabled, and (3) the types of operations Digital Humanists want to see enabled. More information on this can be found in this paper (presented at the DH2013 conference):

In the third project year, the DM2E team is planning to supplement this research paper with a discussion on how the Scholarly Domain Model (SDM) relates to similar activities and if and how these activities map to the SDM. Another experiment with the Pundit tool based on a non-philosophical use case is being investigated, with the aim to demonstrate and evaluate the usefulness and added value of Pundit (especially ASK) and Linked Data: How do relevant research questions translate to the context of Pundit and Linked Data? The additional experiment and the earlier work on the Wittgenstein Incubator will be discussed and analyzed using the terminology of the SDM: Which primitives and activities have been enabled by the experiments and how have operations been enabled through RDF ontologies?

The Advisory Board provided some valuable input on further cooperation with other projects such as Europeana Cloud, DARIAH and Europeana 1914-1918, and approved on the proposed workplan.

Finally, all members agreed that Dirk Wintergrün will serve as interim Chair of the Digital Humanities Advisory Board in the next six months.

Open Humanities Awards – Joined Up Early Modern Diplomacy – final update

This is the final blog in a series of guest blog posts by Robyn Adams and Jaap Geraerts, part of the project team that won the DM2E Open Humanities Award at the Center for Editing Lives and Letters. The final report is available here.

The blind spots of network visualizations

In our last blog we discussed some of the issues regarding the use of network visualizations as well as the limits of the information such visualizations might convey. We will examine this topic into more detail in this blog by employing some of the data derived from our own project. To reiterate a point we previously made, network visualizations often include only one type of relationship, which obscures the various links which connected people to one another. When analysing epistolary networks and the dissemination of information, the omission of such links can be of vital importance, for even when letters were sent to one person, often recipients were asked to pass on information to a third party. Often letters were packages, consisting of multiple letters or including other documents that sometimes were addressed to different people, thus turning a recipient (or the first recipient of the package) into a transmission agent, a person responsible for dispatching the documents or the information to their final destination. Besides the fact that people had different roles, how can we include the flow of information that resulted from people meeting in person to convey the information they received via letters, for instance?

We will illustrate the limits of a visualization of a binary epistolary network by focussing on a case-study, namely the correspondence and the transmission of information regarding the siege of Groningen, which took place in the late-spring and summer of 1594. The following image is a traditional network visualization, the edges representing the letters sent between Bodley and his correspondents regarding the siege of Groningen in the period May to August 1594.1

Fug9qr

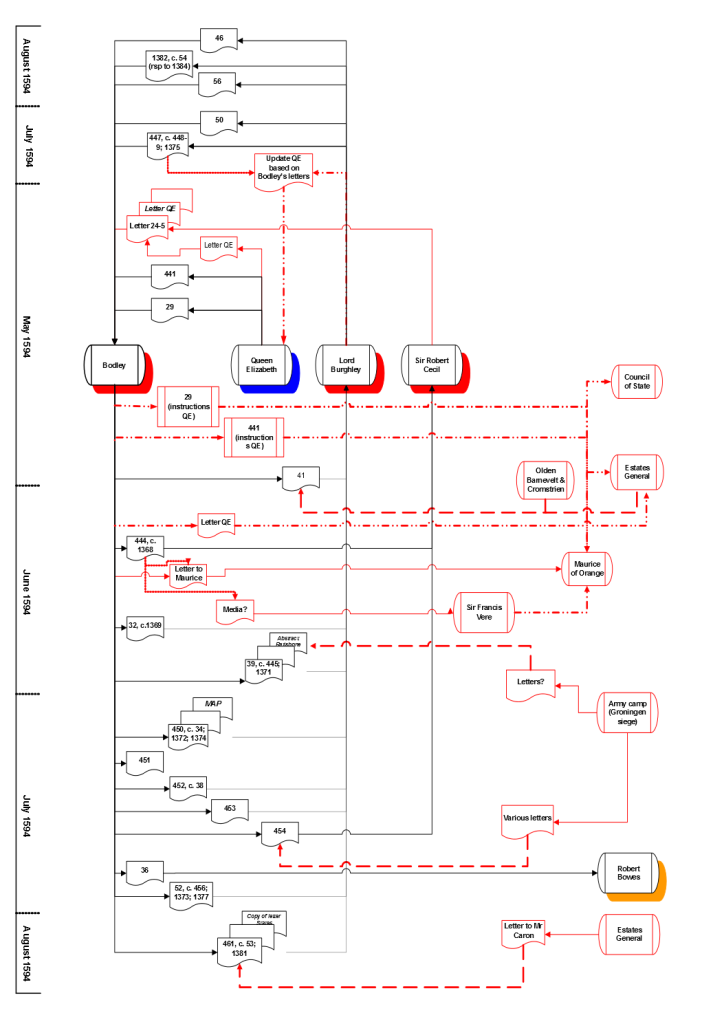
This simple visualization tells us, for instance, that only a small number of people wrote about the siege and that Bodley was the main correspondent, yet there is much more information that is not represented in or by this image. The visualization also creates the impression that, while the siege was of great importance to the Dutch authorities, it nevertheless was only discussed by English correspondents who were part of the epistolary network. In order to show which people actually were involved in transmitting information, the way in which they did this, and the various links that were forged in the process of disseminating information about the siege, we returned to the primary sources. Extra research was necessary as we wanted to move beyond the basic relationship codified in our dataset, namely the authors and recipients of the letters, to include a large palette of connections which linked people to one another. The results are visualized in a SDL-diagram, which is normally used to depict processes within a particular system (e.g. a computer program), yet its format enabled us to track the flow of the information as well as the various actions and the ensuing relationships. The diagram follows after the figure below, which is a key to the symbols used.

Case study II Groningen (SDL)

SDL diagram explanation

Because of the density of the information included in the diagram, it might be initially more challenging to ‘read’ the image, but it immediately becomes apparent that a lot more people were involved in the exchange of information regarding the siege than has been shown in the network visualization, including the Dutch stadholder, Maurice of Orange, and Sir Francis Vere. Other relationships are also visible: in her letter to Bodley (letter id. 29), Queen Elizabeth asked him to convey the Queen’s message to the Council of State, the Estates General, and to Maurice of Orange. It is likely that Bodley went to see the members of these political bodies in person in order to pass on the information, hence links were created that existed outside of but are closely related to the epistolary network.

The diagram makes it clear that Bodley was not ‘just’ a correspondent, but also acted as a transmission agent, and the people who normally took care of transporting the letters, the bearers, can be easily included in the diagram as well (thus expanding the network and more clearly showing the different people who were involved in the transmission of information and who connected the various correspondents to one another). The sources from which Bodley derived his information are also shown: on July 14, 1594, Bodley wrote to Robert Cecil (letter id. 454) about the siege and he mentioned that he had received letters from the army camp at Groningen which provided him with information. The symbols indicate where other documents were enclosed with the letters sent between the correspondents: a letter package from Bodley to Burghley included a map about the siege of Groningen, one of the three maps about the siege Bodley sent to England.2

The SDL-diagram is one way of including various types of relationships and different flows of information that are difficult to include in many network visualizations (when using open source visualization software). Instead of depicting straightforward binary networks consisting of authors and recipients, we can zoom in closer, as it were, and show the material processes of collecting and disseminating information in more detail. Moreover, using such visualizations enables us to capture the complexity of the historical data as well as the diversity of the network. Arguably this comes at the cost, for it is difficult to visualize a large dataset in this way, but it opens up possibilities of visualizing networks without losing too much of the complexity and richness of the historical data which makes it so interesting to study in the first place. It also enhances our understanding of the often idiosyncratic process of gathering and spreading information and the fluid character of early modern information networks, aspects which tend to be ill-represented in neatly constructed network visualizations.

1 Gephi and Inkscape have been used to create this visualization. The letters that have been selected all mentioned the city of Groningen in the period in which the siege took place.

2 For the maps, see: Robyn Adams, ‘Sixteenth-Century Intelligencers and Their Maps’, Imago Mundi: The International Journal for the History of Cartography 63:2 (2011), 201-16.

Open Humanities Awards – Maphub final update

*This is the final blog in a series of posts from Dr Bernhard Haslhofer, one the recipients of the [DM2E Open Humanities Award](http://openhumanitiesawards.org). The final report is available here. *

Semantic Tagging in Maphub – Final Results and Lessons Learned

Maphub (http://maphub.github.io) is an open source Web application which allows people to annotate digitized historical maps. It pulls maps out of closed environments, adds zooming functionality, and assigns Web URIs so that people can talk about them on the Web. It has been built as a demonstrator for the W3C Open Annotation specification (http://www.w3.org/community/openannotation/), which currently works towards a common, RDF-based, specification for annotating digital resources. Here is a screenshot of the prototype application:

maphub.jpg

A first prototype (http://maphub.herokuapp.com) has been bootstrapped with a set of around 6,000 digitized high-resolution historical maps from the Library of Congress’ Map Division. It allows users to retrieve maps either by browsing or searching over available metadata and user-contributed annotations and tags.

Technical Details

Semantic tagging is part of Maphub’s annotation feature: to create an annotation, users markup regions on the map with geometric shapes such as polygons or rectangles. Once the area to be annotated is defined, they are asked to tell their stories and contribute their knowledge in the form of textual comments. While users are composing their comments, Maphub periodically suggests tags based on either the text contents or the geographic location of the annotated map region. Suggested tags appear below the annotation text. The user may accept tags and deem them as relevant to their annotation or reject non-relevant tags. Unselected tags remain neutral.

The screenshot in the next figure shows an example user annotation created for a region covering the Strait of Gibraltar. While the user entered a free-text comment related to the naming of the area, Maphub queried an instance of Wikipedia Miner (http://wikipedia-miner.cms.waikato.ac.nz/) to perform named entity recognition on the entered text and received a ranked list of Wikipedia resource URIs (e.g., http://en.wikipedia.org/wiki/Mediterranean_sea) in return. URIs should not be exposed to the user, so Maphub displays the corresponding Wikipedia page titles instead (e.g., Mediterranean Sea). Since page titles alone might not carry enough information for the user to disambiguate concepts, Maphub offers additional context information: the short abstract of the corresponding Wikipedia article is shown when the user hovers over a tag.

annotation.png

Once tags are displayed, users may mark them as relevant for their annotation by clicking on them once, which turns the labels green. Clicking once more rejects the tags, and clicking again sets them back to their (initial) neutral state. In the previous screenshot, the user accepts five tags and actively prunes two tags that are not relevant in the context of this annotation.

Sharing Annotations and Semantic Tags

Sharing collected annotation data in an interoperable way was another major development goal. Maphub is an early adopter of the Open Annotation specification and demonstrates how to apply that model in the context of digitized historic maps and how to expose comments as well as semantic tags. As described in the Maphub API documentation (http://maphub.github.io/api), each annotation becomes a first class Web resource that is dereferencable by its URI and therefore easily accessible by any Web client. In that way, while users are annotating maps, Maphub not only consumes data from global data networks – it also contributes data back. The following screenshot shows how the previous annotation could be represented following the Open Annotation specification.

maphub_oa_comment.png

Tagging Experiments

While working on Maphub, its semantic tagging functionality has become our core research interest. We conducted an in-lab user study with 26 participants to find out how semantic tagging differs from label-based tagging and learned that there was no significant difference in its tag production capacity, in the types and categories of tags added, and in overall user task load. Hence, semantic tagging as implemented in Maphub could produce the same result as a label-based tagging, with the main difference that semantic tagging gives references to unambiguous Web resources instead of semantically ambiguous labels. More details on the methodology and results of that experiment are described in our report available at (http://arxiv.org/abs/1304.1636).

Enabling Annotations and Semantic Tagging in other Applications

We found that semantic tagging might be useful for other application scenarios as well. Therefore, with the support we received from the Open Humanities Award, we added a semantic tagging feature to Annotorious (http://annotorious.github.io/), which is a JavaScript image annotation library that can be used in any Website. Annotorious is also compatible with the Open Knowledge Foundation’s Annotator (http://annotatorjs.org/) tool. Our next research and development steps will go into two main directions: (i) providing a more efficient and lightweight (semantic) tag suggestion service, and (ii) improving tag recommendation strategies.

Report of the DM2E Pundit UI/UX event, 2 April 2014, Berlin

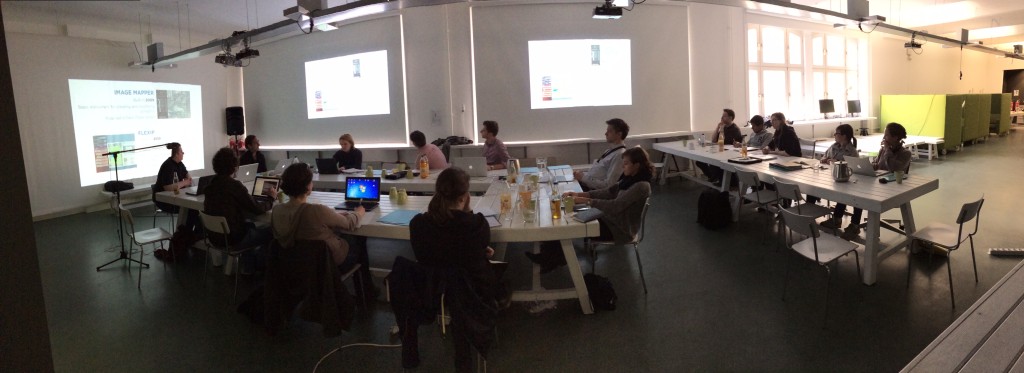
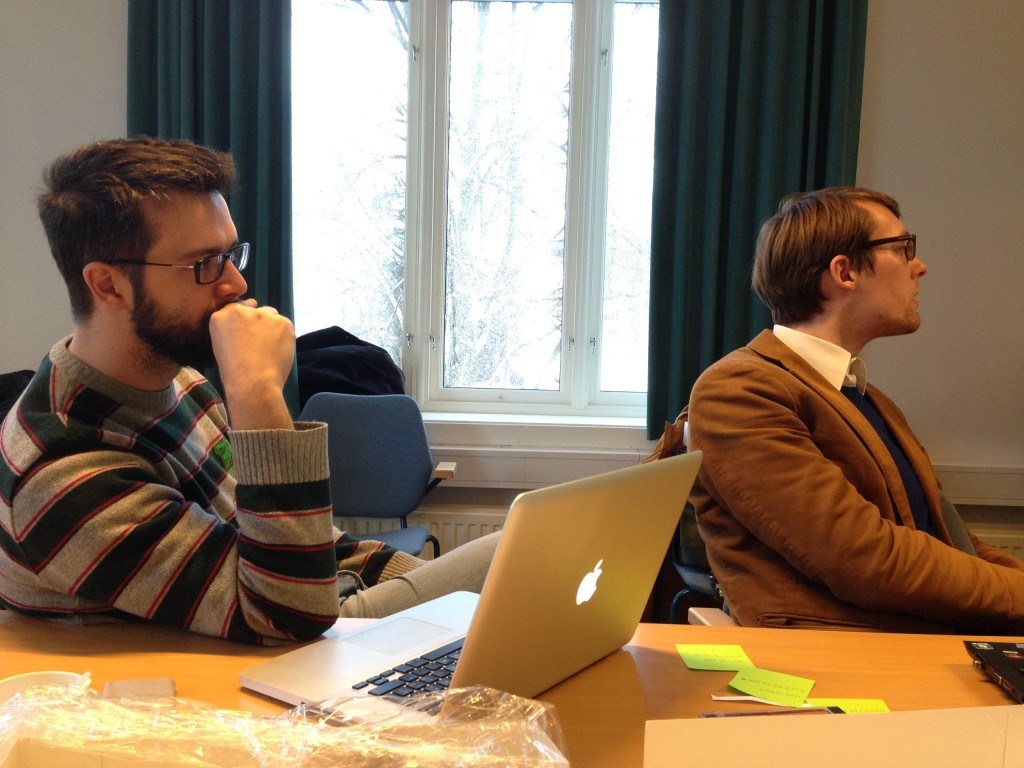
On 2 April the DM2E project organised a full day event on Pundit, the web-based semantic annotation tool that is being developed in work package 3. The event was held at the Bild Wissen Gestaltung (BWG) Cluster of Excellence of the Humboldt University in Berlin and attracted a full room of participants eager to discuss their ideas on Pundits User Interface and User Experience.

IMG_0023


The day started with an introduction to Pundit, given by Simone Fonda of Net7, lead developer of the Pundit annotation tool at Net7.

Next, Friedrich Schmidgall (Humboldt University) and Giulio Andreini (Net7) gave an interactive tour of Pundits improved user interface and its new features, including the Template Highlighting Feature (for making repeated annotations faster) and the Automatic Suggestion feature (for automatically extracting entities from the whole text of the page or from the selected text). In addition, several prototype showcases were presented to demonstrate the functionality of this new Pundit version.

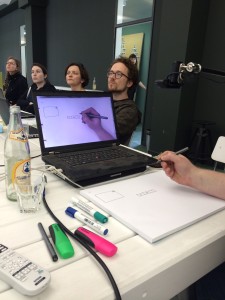
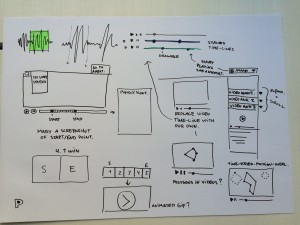
After lunch, there was time for participants to present their use cases of Pundit, and discuss possible future improvements and extensions of Pundit (such as for example annotating sound fragments), while input was sketched live and shown on the screens.

IMG_0024           IMG_0027


All in all, it was a successful and useful event for gathering input on the future development of the Pundit tool – with thanks to the Bild Wissen Gestaltung Cluster of Excellence of the Humboldt University in Berlin for the great hosting!

Register now for the DM2E Pundit UI/UX event, 2 April, Berlin

pundit2

Pundit, the open source semantic web annotator tool that is being developed within DM2E, is organising a full day event on 2 April 2014 in Berlin to hear your ideas on its User Interface and User Experience.

After winning prizes, being adopted in various environments and successfully adding semantic information to thousand of web pages using gazillions of Linked Open Data objects, developers and designers are working their brains off on the next version of the tool.

This new version will make it possible to annotate faster, more easily and with less distractions, without losing its powerful semantic expressivity. Not an easy task: that’s why we want to hear from you!

What do you expect from the new version of Pundit? How can we, together, best develop this open source tool for a better, faster, stronger semantic web? Join us at the Humboldt University in Berlin on 2 April 2014 for the DM2E Pundit UX/UI event.

ProgrammeDM2Elogo

  • 9.30 Registration and coffee
  • 10.00 Introduction to the day and demonstration of the proposed updates to the Pundit user interface
  • 12.00 Lunch
  • 13.00 Hands on session: brainstorming, tests and hacks on prototypes and mockups
  • 17.00 End

LocationAmpelmann_gruen

  • Exzellenzcluster »Bild Wissen Gestaltung« / Cluster of Excellence »Image Knowledge Gestaltung«, Humboldt University Berlin
  • Sophienstraße 22a, Berlin-Mitte, 2nd backyard, 2nd floor, right wing
  • Google Maps Link
  • Public transport: U8 – Weinmeisterstraße or S-Bahn – Hackescher Markt

Registration

Attendance to this event is free, but due to the limited amount of places available we need you to register your attendance by sending an email with your name and institution to [email protected].

Registration closes on 28 March (or earlier when the event is fully booked).


Open Humanities Awards – Joined Up Early Modern Diplomacy – Update 5

*This is a guest blog post by Jaap Geraerts. Jaap works as part of the team that won the DM2E Open Humanities Award at the Center for Editing Lives and Letters.*

[In the previous update](https://dm2e.eu/open-humanities-awards-joined-up-early-modern-diplomacy-update-4/) we touched upon the relationship between the data and the software used for creating visualizations and this blog expands on this topic, for it is becoming increasingly apparent that -‘modern’- research techniques such as visualizations and network analysis have their own pitfalls. [In a perceptive blog post](http://www.scottbot.net/HIAL/?p=39600), Scott Weingart raises the question when the use of networks is and is not appropriate, and he rightfully states that network structures can be deceitful, partly because the algorithms used in network software are based on specific assumptions. Moreover, the data used for a network analysis can be biased or skewed, obscuring relationships between people or over-emphasizing the centrality of a person within a network. Networks also contain only so much information: the network structure of the data-set of our ‘Joined Up Early Modern Diplomacy project’, for instance, consists of the links between people that are solely based on their correspondence, leaving out the whole range of other relationships derived from family ties, friendships, et cetera. The relationship between Robert Cecil and William Cecil, for example, did not merely consist of the two letters the latter (father William) sent to the former (his son Robert). To give another example from the Bodley data-set: Anthony and Francis Bacon individually corresponded with Bodley, yet outside this epistolary network these brothers shared at least one link (kinship). This points at the existence of various networks of which people were part and the different positions people had in these networks (i.e. even though a certain person may have been a central figure in an epistolary network, this does not mean that he is in the centre of other networks in which he operated). For example, whereas person A is central in an epistolary network (he corresponded with B and C, two people who did not write to each other), in the social network of these three people, person B was central (having met person A once, and person C very often – B and C were cousins – while A and C never met). As such, network structures and visualizations of networks only show a part of ‘reality’, as networks are, naturally, dependent on the data with which they have been created.

Another difficulty when aiming to produce visualizations based on historical data can be the lack of context or points of reference for the viewers. Consider the following visualization, for instance:

Map

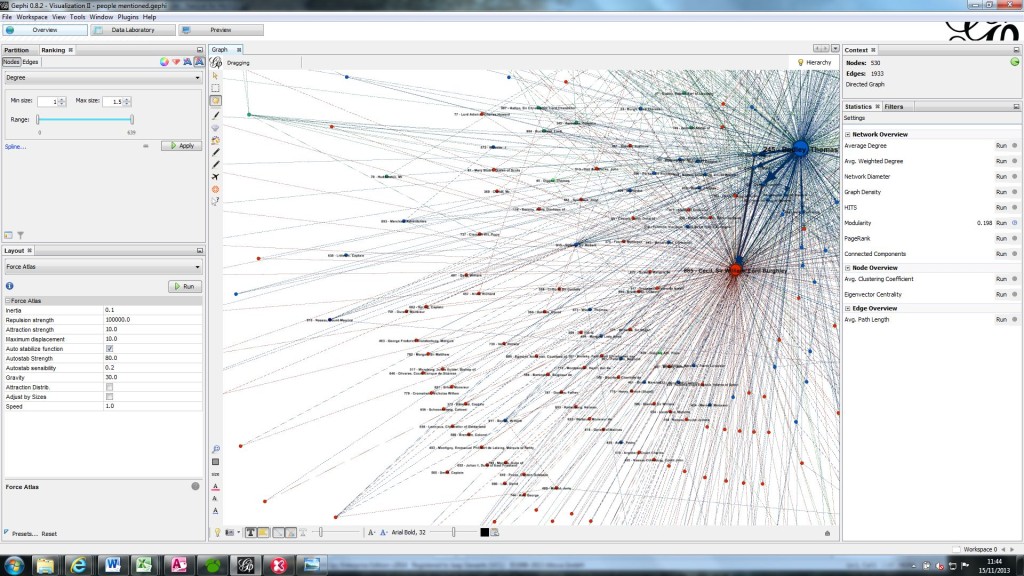
Even without knowing what these blue dots mean, the viewer instantly recognizes that this image tells us something about the United States of America. The image, which shows the number of people who board or alight a flight (and where), can be explained very easily. Even though much is left unexplained in this image, the fact that the context is rather obvious and the fact that the data easily can be used to show density, makes this an effective visualization. However, in other cases the density of a network structure and the often resulting [hairballs](http://www.vpascual.org/blog/wp-content/uploads/2012/06/Screen-Shot-2012-06-17-at-20.16.02-.png), unintelligible clutters of nodes and edges, are more confusing than explanatory. When aiming, for instance, to include another layer of data into an epistolary network (such as the people mentioned in the letters), the result can become something like this:

Map2

This is an extreme example as the visualization has not been modified by using algorithms and filters, but it exemplifies how easily visualizations can become meaningless when using substantial layers of data in combination with the lack of a clear context. It therefore behoves the scholar to consider the particularities of the data and its possible limits as well as the aim of the visualization before enthusiastically pouring the data into computer programs. Furthermore, how to integrate the visualizations with the scholarship that underlies the visualization? And how do the visualizations tie in with the aims of the research and in what way do they enrich this research?
Possible ways of dealing with complex data can be to use different types of visualizations which show aspects or parts of the data set, perhaps to elucidate an aspect of the dataset which is otherwise difficult to perceive. Another option is to focus on a specific part of a larger visualization, or to approach the data from a specific angle (e.g. how did topic X flow through an epistolary network) in order to highlight the specifics of the network. Although countless options are imaginable, incorporating various visualizations into a narrative structure is a potential way of dealing with a complex data set, as the text can provide the much-needed (historical) context while also explaining the limits of the visualization to the reader. This does not mean that each visualization is accompanied by a lengthy explanation, but rather that the text and the visualizations support each other so that visualizations are not merely an addition to a story, but become part of it.

The point is that complex data can be visualized, but often at the cost of losing some of the complexity which makes the data (or sources) so interesting to study in the first place. When standing on their own, modern research techniques such as visualizations do not always add significantly to the existing scholarship: the crux is to combine these innovative techniques with more ‘traditional’ scholarship and to integrate the methodologies that are used for the gathering and mining of archival data in order to be able to push the boundaries of the research undertaken in the fields in which we are working.

Wittgenstein Incubator Workshop, Bergen, 6/12/2013

1P06n9Jl9DYBUN9wxqWCPRtJ5aoCoUQErzyODtQ
Simone Fonda lead developer of DM2E annotation tool, Pundit, and Gerold Tschumpel of Humboldt University

One of the primary goals of the DM2E project is to build a set of tools that can be used to support and further humanities scholarship. Early on in the project a group of specialists on the influential twentieth century philosopher, Ludwig Wittgenstein, were identified as a key scientific community for the tools under development. The scholars based at the Bergen Wittgenstein Archives at the University of Bergen, also a content provider to DM2E, have been consulted throughout the development of the project’s flagship annotation tool, Pundit.

At the end of December members of this very community of Wittgenstein experts and digital humanists gathered in Bergen to give feedback on their experiences using Pundit to annotate Wittgenstein’s digitised manuscripts that have been made available through [Wittgenstein Source](http://www.wittgensteinsource.org/). Many of those present had been involved in the Agora and [Discovery](http://www.discovery-project.eu/home.html) projects, which had undertaken much of the technical groundwork which DM2E has built on.

As preparation for the workshop all participants had been asked to do some exercises and complete a survey with the DM2E annotation tool, Pundit. After a welcome by Alois Pichler from the Wittgenstein Archives, Kristin Dill of DM2E partner the Austrian National Library opened up proceedings with a brief introduction to the project and a presentation of the survey results to get a sense of some early responses to Pundit from the group present.

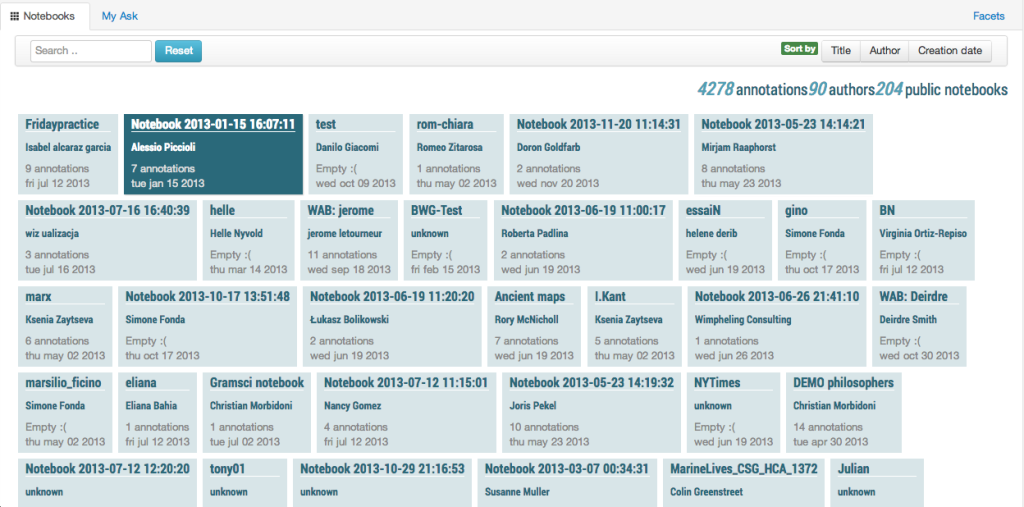
The DM2E partners behind Pundit, Net7, demonstrated a new and important aspect of the annotation tool, called AskThePundit. Ask enables users who have created annotations in Pundit to share their own “notebooks” and discover those of others. The platform offers an incredibly powerful way to connect users and enable novel presentations of sets of annotations. Pundit is increasingly being taken up and integrated in other tools for Wittgenstein research, like for example the splendid search tool [WiTTFind](http://wittfind.cis.uni-muenchen.de/) developed at the [LMU-CIS](http://www.cis.uni-muenchen.de/index.html) in Munich.

If you’re interested you can check out the current Beta version of Ask [here](http://ask.thepund.it/). The demonstration of the platform was very well received by the participants.

113JG-tgbz-ujLYJ3VXFzeoDWD2SiBQdLs2PsEQ
A screenshot of notebooks as displayed in AskThePundit

On top of the demonstration of the AskThePundit platform, the Net7 team demonstrated impressive integrations that had been developed with Pundit allowing users to visualise networks of influence and create timelines using from Pundit annotation data.

The second-half of the day was dedicated to an open discussion in which the researchers could discuss in detail their experiences using Pundit and suggest possible improvements to the software. Key points and feature requests that emerged from the lively discussion that followed were as follows:

###Feature requests for Pundit and AskThePundit

* An option for licensing your annotations according to how you would like them to be used;
* More possibilities for visualising graphs created by annotations;
* Make it possible to “reply to” annotations;
* Allow users to search for annotations with a URL;
* Allow annotations to be grouped by the time created;
* Enable users to delete annotations.

###General comments

* More Linked Open Data and content is needed before scholars can really feel like they are acting as if in a library in the Linked Data cloud;
* Better documentation should be made available for using ontologies so that it’s clearer how to use them.

During the latter stages of the day some interesting questions were raised concerning the opportunities for community building around tools like Pundit that offer humanities researchers new ways of working with traditional texts. A key issue that was identified by participants was that many researchers were not accustomed to using digital environments for the creation of annotations, let alone the creation of annotations as Linked Data. It was therefore felt that the best means of engaging the scholarly community in the use of novel digital humanities tools was through working with students and young researchers who were digital natives and more flexible in their approach to working with texts.

The day was wrapped up by Kristin Dill of the Austrian National Library. As a follow up, participants were given an opportunity to rate the various features that had been demonstrated during the day in the form of a survey. Data from this survey will help the DM2E team evaluate how successfully the current version of Pundit responds to the scholars’ needs.

Project Meeting 4, Athens 28-29/11/2013

2013-11-28 09.36.12
Doron Goldfarb of the Austrian National Library and leader of Workpackage 1

At the end of November the DM2E Consortium met in Athens to review progress made on the project so far and strategise about the next six months. The two days also involved presentations from two other Europeana projects, Europeana Cloud and Europeana Inside, both with overlaps with the technical work within DM2E. The presentations were followed by a lively debates on how DM2E can best demonstrate its value to the scientific community it serves.

The meeting began with a review from each of the four Workpackages on the last six months. Presentations from each of the Workpackage leaders can be found below:

Following on from the updates, Klaus Thoden of Workpackage gave a presentation of the preliminary results of the contextualisation of the digitised manuscripts data made available to the project by the content providers:

During the afternoon of the first day the DM2E Consortium had the opportunity to demo the tools being developed as part of Workpackage 1.

For the next section of the stage was given over to two related Europeana project, Europeana Cloud and Europeana Inside, as a basis for discussion for possible future collaborations. Gordon McKenna provided some background on the Europeana Inside project, his slides can be found below:

Joris Klerkx followed up with a similar exposition of the work of Europeana Cloud, identifying possible avenues of collaboration between Europeana Cloud and Europeana Inside.

Open Humanities Awards – Joined Up Early Modern Diplomacy – Update 4

blog IV image 2

*This is a guest blog post by Jaap Geraerts. Jaap works as part of the team that won the DM2E Open Humanities Award at the Center for Editing Lives and Letters.*

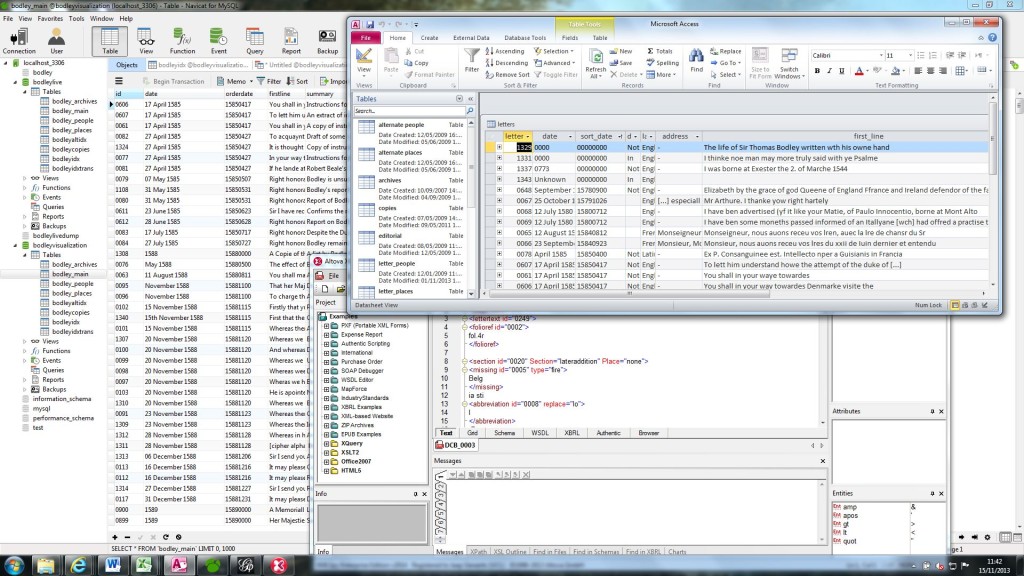
Since the [last update](https://dm2e.eu/open-humanities-awards-joined-up-early-modern-diplomacy-update-3/) about the Joined Up Early Modern Diplomacy project I have devoted a bit of time to the rationalization of the databases which have been created for this project. As the data of the Bodley project is stored in two databases (an ACCESS database and a MySQL database which powers the website) and both of the databases will be used to create the visualizations, it is important to ensure that both databases contain similar data. Moreover, we tried to see which data that was stored in the ACCESS database could be included in the MySQL database in order to enhance our understanding of Bodley’s correspondence network. The XML-files which contain the transcriptions of the letters that are visible on the website of the project had to be updated as well in order to keep them aligned with the updated databases, and all of this shows the work which precedes the creation of the actual visualizations – and I have not even started talking about the whole process of thinking about which visualizations are worth making, a topic which will be addressed in the next blog.

blog IV image

After the process of populating and updating the databases it is time to take the next step towards creating the visualizations, which is the prepare the data to be imported into GEPHI, the software we use to construct the visualizations. As GEPHI requires the data to be presented in a specific format which enables the software to connect the authors to the recipients of the letters and thus to construct the network, the data has to be exported from the database in a particular way.

Moreover, the way GEPHI thus looks at data poses interesting questions about how we view historical data ourselves. For instance, the issue of how to represent the fact that a letter had two or more authors in GEPHI raises the questions whether we should see these historical figures acting as one entity when writing such a letter. In other cases, especially when aiming to move beyond the ‘mere’ visualization of Bodley’s network by including other layers of information, such as the people and places mentioned in the letters, the question is how to capture the historical context and the wealth of the primary sources into a standardized piece of twenty-first-century software. Furthermore, the editorial decisions made by the research team in the development stage of the correspondence project meant that ‘correspondence’ was a fluid term: the bulk of the corpus comprises letters directly to or from Bodley, but also includes items sent in letter packets which, although epistolary in concept, do not necessarily have an addressee (or one that is immediately apparent, e.g. Bodley’s passport and cipher).

The examples given above bear witness to the fact that when using IT-software the researcher is obliged to engage in a dialogue between the software and the historical sources, and it is exactly at this point that IT-skills and the skills of a historian intersect. In addition, these examples serve as a reminder that while IT-software is able to create new insights and helps to address new research questions, a lot of extra work is necessary in order to gain the desired results, which in turn adds scholarly value to the technical resource. In this sense, it is important to remember that the tools embraced by the research taking place within the digital humanities do not magically provide extremely interesting results – rather, using some of these tools is like opening the box of Pandora. In this rapidly changing field of research, then, traditional skills such as scholarly diligence are needed more than ever.