This blog post introduces our newest member of the Centre for Editing Lives and Letters project team, Jaap Geraerts. Jaap is the research assistant on the ‘Joined-Up Early Modern Diplomacy’ project, and will be working to generate visualizations from the Bodley project data until the end of December 2013. Jaap is ideally suited to this role, nearing the completion of his PhD in the UCL History deparment which focuses on early modern marriage practices of elite Low Countries families, as well as having solid technical skills from both his higher education and previous work experience.
Jaap writes:
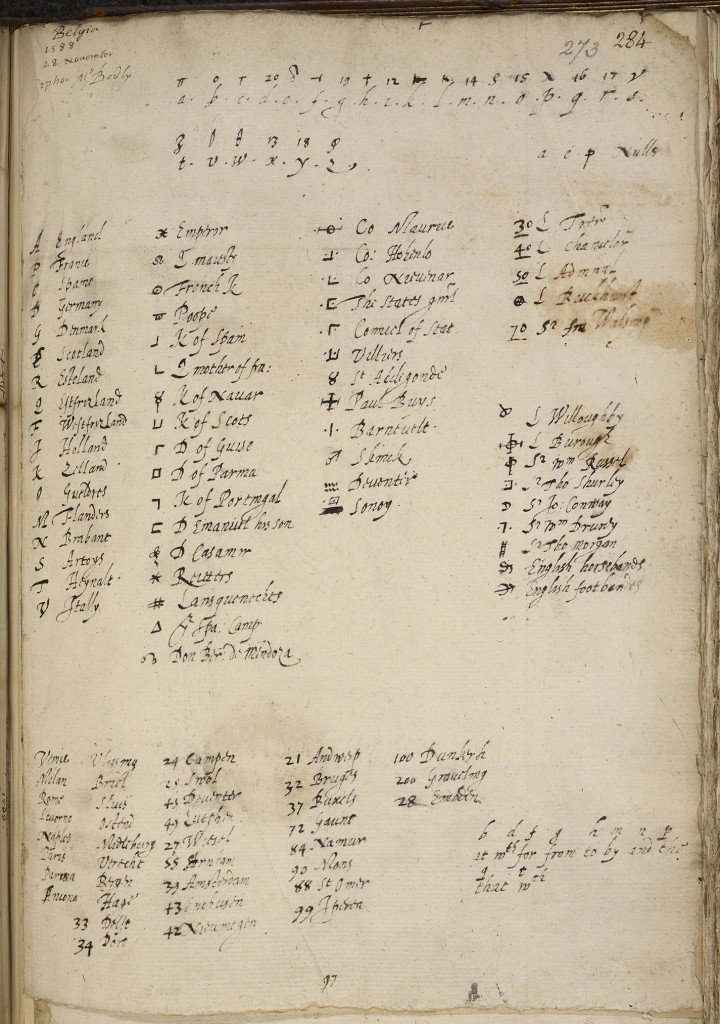
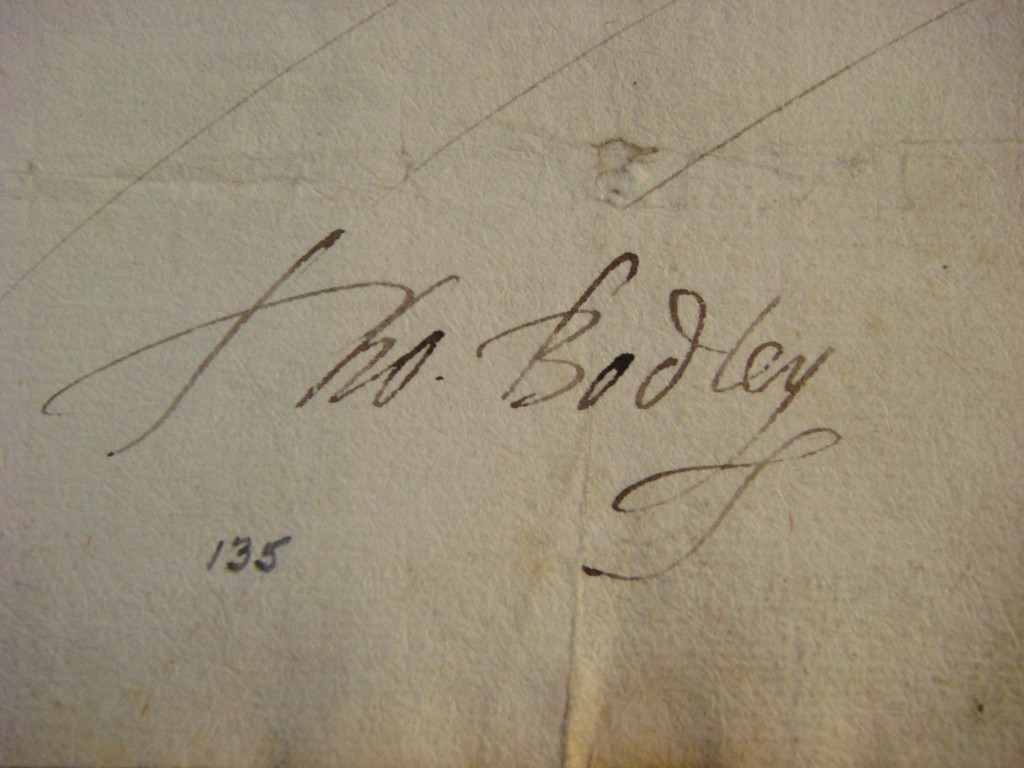
‘From 1588 to 1597 Thomas Bodley served as the English ambassador in the United Provinces and was stationed in The Hague, while also representing his country in the Dutch Council of State. In this period Bodley sent and received around a 1000 letters, and thanks to the arduous work of Dr Robyn Adams we have access to a wealth of data, such as the places and people mentioned in the letters and the names of the authors and recipients of the letters. My main task as the research assistant of this project is to use this data to provide meaningful and insightful visualisations, which means that the visualisations should increase our understanding of Bodley’s network of correspondents and of the information that was spread through this network (the so-called ‘data-flow’).
In order to get started with the project I began with a survey of the various visualisation projects within and without the Digital Humanities to get an idea of the different ways in which data can be visualised. The Digital Humanities are a hot topic at the moment, with on-going projects such as HISGIS, Mapping the Republic of Letters, Mapping Books, and of course the various projects undertaken here at CELL, to name but a few. Moreover, conferences and seminars aim to discuss the research undertaken in the Digital Humanities and the methodological implications of using computer software such as Geographic Information Systems and Social Network Analysis, among other things.
It immediately became apparent that many different ways to visualise data are used, ranging from boxplots to fancy images that show networks of correspondents and their physical locations. The way in which the data is presented is of huge influence on the insights provided by the visualisations, and an important part of this project will therefore be to think about how we best can present the data that is gathered from Bodley’s letters. In this project the visualisations will be done in Gephi, open-source software which is mainly used for Social Network Analysis. One of the advantages of Gephi is that it is constantly updated, making available new functionalities and thus keeping up with the latest developments within information technology as well as with the wishes of its users. Furthermore, the program is user-friendly and provides tools for the manipulation of the data, enabling the user to highlight different aspects of the network, such as the centrality of a specific person in a network. It is important that the software is capable of producing the visualisations we want, for although resorting to information technology for our scholarly needs, the desired visualisations are the outcome of our academic interests and do not depend on the capacities of specific software. The goal is not just to produce pretty pictures: after all, we are still historians!
One of the tasks I have set myself since joining the project is to familiarise myself with the context as well as the content of the network, and its foundation of manuscript correspondence. Early modern letters are a fascinating archival resource with a specific set of features which lend themselves well to networks and systems of mapping social interaction. One of my main priorities during this project is to push the boundaries of historical network analysis and data visualization, and see if our understanding of the aforementioned specifics of epistolary communication (i.e. relating to letters) can be enhanced by the technology available to us for producing visual connections and meaning. Watch this space!’

