This is the final post from Dr Rainer Simon, one the recipients of the DM2E Open Humanities Awards – Open track. The final report is available here.
Last Thursday, the University of Applied Sciences Mainz was the scene of our second SEA CHANGE annotation workshop. First things first: Mainz broke the record! Despite a few participants less than last time in Heidelberg and, overall, a few minutes less time, they made it. Below, I’ll speculate a bit on how and where Mainz may have scored those extra points. But for the sake of completeness, I should point out that this public boasting on twitter by our host Kai-Christian Bruhn would have made a day without breaking the record SOMEWHAT embarrasing 😉
But Kai’s students did not let him down. The day ended with a breathtaking 7.511 contributions, totally smashing our previous record of 6.620 by almost 900! Totes amaze. We were knocked out by their efforts. Kudos to the students at Mainz!
Annotation Session
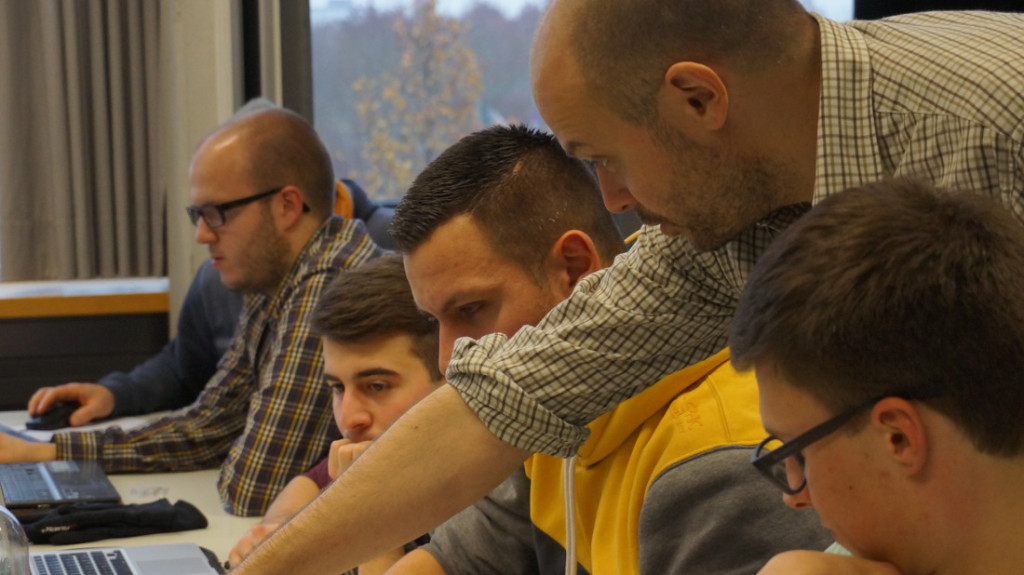
Like last time, Leif and I kicked off the day by introducing the Pelagios project (into which the SEA CHANGE results feed into) to our audience. Participants had a mixed background (engineering and archaeology), attending a joint course in both universities in Mainz. After a guided tour of our Web based geo annotation tool Recogito people got to work.
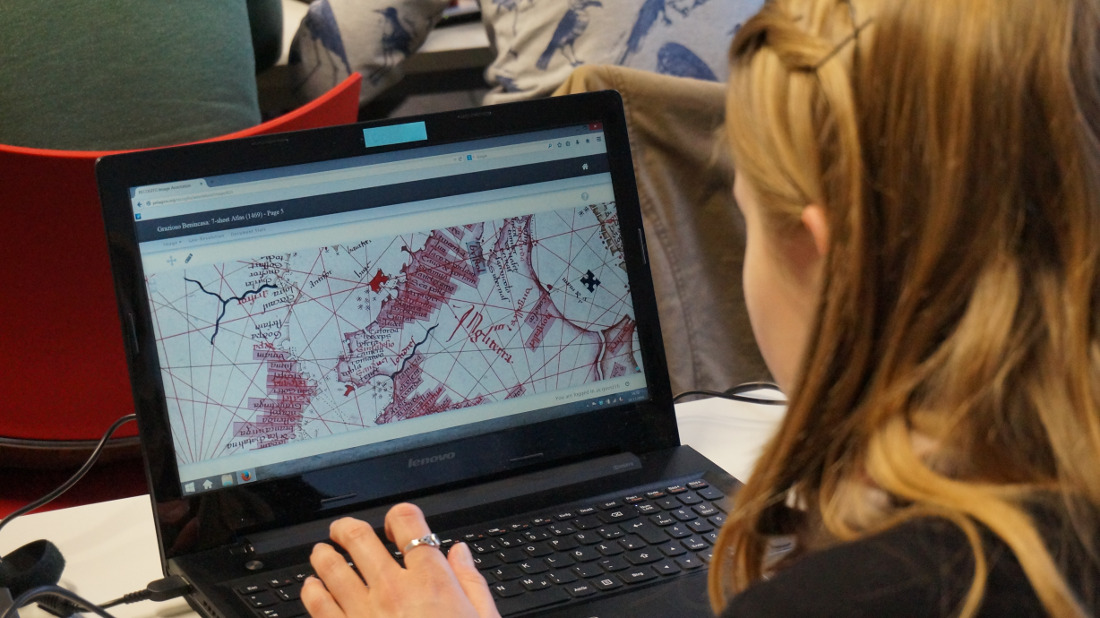
At times, the silence in the room was almost eerie as the students set about working on, in a highly concentrated way, a selection of both texts (Medieval geographic narratives and travel writing) and maps (a set of beautiful maritime charts from the 14th and 15th century). Despite the fact that most students missed the expert knowledge about the texts and historical background, they obviously found it meaningful to add annotations. They grasped the idea and, to quote Kai, They won the race because what they were doing during the annotation session was meaningful to them.
To back this up with some numbers: here’s the sum total of what the day ended with.
- Approx. 2.600 place name identifications in text. That’s almost an identical number to our first workshop. So far so good.
- Almost 3.200 place name identifications on images. Wow! That’s almost 700 more than last time!
- About 620 map transcriptions. That’s a bit less than last time, where we had 830.
- My personal favourite: 544 gazetteer resolutions. That’s almost four times as many as last time! Gazetteer resolution is the type of activity that’s most complex and time-consuming. Since our last workshop, we completely overhauled the user interface for this, and it’s great to see such an improvement.
- 537 other activities such as corrections, comments, deletions, etc.
It’s good to see how stable the number of place name identifications in text was. This seems to show that (despite the occasional glitch and known issue) Recogito has really reached a level of maturity now. It’s also interesting to see how many more place name identifications we had in images this time. My personal take on this is that the different material may have played a small part in there, too. Portolan charts are very “dense” in place names, and the place names are typically arranged in sequence, in the same orientation. So there is less need to search and navigate the map. That may have allowed for slightly speedier tagging this time. On the other hand, though, the style of lettering in these maps was rather different from last time and much more challenging for the non expert to decipher. This may well be the reason why we got a lower number of transcriptions on this occasion. But in any case: the overall result speaks for itself.
Data Re-Use Session
The late afternoon was again dedicated to the topic of data re-use. This time, however, we tried something a little different. We ran two sessions in parallel. Participants could choose between them, depending on their own interest and background. Leif once again walked his half of the audience through a tutorial that uses the Open Source Geographical Information System QGIS to explore a medieval travel itinerary embedded in 3D terrain. (The resulting 3D visualization is available online here). In the meantime I ran a small “Pelagios hack tutorial” in which I guided the other half of the audience through three JavaScript examples that demonstrate how you can easily re-use Pelagios data in your own applications and mashups through our API, e.g. to create Web maps, timelines or network graphs. (The tutorial examples are on GitHub here.)
Well, I guess this concludes the SEA CHANGE project. Leif, Elton, Pau and I are happy to have gotten the opportunity to do this, and are very excited about what came out of it. We would love to repeat workshops like these at some point. (Maybe also in virtual online form?) If you’re interested in participating or hosting: by all means, do get in touch!
Last but not least (my standard reminder…): above all, our project is about gathering data and making it openly available to everyone. So do take a look at the CC-licensed annotation data that is now available for download through Recogito, as well as through the Pelagios API. We’d love to hear from you!
Comments are closed.